ProjectExplorer 6 for Autodesk Civil 3D
User Guide | Working in Profile and Section Views
Working in Profile and Section Views
ProjectExplorer features a range of dynamic section and profile views which provide a live insight into elements within your Civil 3D design.
Introduction
Each of these views share a range of common features, and dedicated controls. For instance:
Profile View - View the entire collection of profile geometry associated with any selected Civil 3D alignment, and compare station and elevation values with other elements in your design.
Assembly View - View a cross section through any assembly in your drawing, easily identify individual subassemblies, and directly edit any subassembly parameter.
Corridor Section View - View a dynamic cross section through a corridor at any baseline station, and easily identify specific link, point, and shape codes, and individual subassemblies. Compare offset and elevation values with other elements in your design, such as existing ground surfaces.
Feature Line View - View a dynamic profile along any selected site feature line, and compare station and elevation values from the selected line with other elements in your design.
Pipe Network (Pipe Run) View - View a dynamic profile along the shortest pipe run path through any pipe network between a nominated start and end structure. Compare the station and elevation values of the pipe run with other elements in your design.
Sample Line Group Section View - View a dynamic cross section through the location of any sample line, including all associated section lines. Compare offset and elevation values with other elements in your design, such as existing ground surfaces.
Common Concepts and View Features
View features which are common to all views are generally accessed from the right-click menu within the view canvas, or from the status bar along the lower edge of the view.
Status Bar Controls
The status bar runs along the lower edge of each profile and section view, and contains a number of common controls.

- On the left of each status bar is a drop-down list of scale factors which allows you to select from a series of vertical scale exaggeration factors which can be instantly applied to the view.
- Next is a drop-down list of zoom modes, which allow you to decide whether zoming in the view affects both axes, or just the horizontal or vertical axis. Use the latter options to dynamically adjust the vertical exaggeration factor in the view.
- Next is a series of buttons which allow various graphical elements in the view to turned on or off - such as grid, text, axis, and shading.
- Finally, on the right side of each status bar is a coordinate readout which identifies the location of your cursor in the view in terms of station and elevation (for profile views) or baseline offset and elevation (for section views).
Zoom and Pan
To zoom in or out in any profile or section view, scroll the mouse wheel. Pressing and holding the CTRL button whilst you move the mouse wheel will increase the zoom speed, whereas pressing and holding the ALT button whilst you move the mouse wheel will decrease the zoom speed.
To pan in any profile or section view, press and hold the mouse wheel button whilst moving the mouse.
To zoom to the outer extents of displayed content, open the right-click menu from the view canvas and select Zoom to Extents. To pan to the center of the displayed content, open the right-click menu from the view canvas and select Pan to Center.
To limit zooming to the horizontal or vertical axis only, press the magnifying glass symbol on the status bar and select the desired zoom mode setting. Limiting the zoom function to a single axis in this way will cause the vertical scale factor to change dynamically. To reset the vertical scale factor to a specific value, use the drop-down list on the left side of the status bar.
Styling Preferences
To control the default colors, grid spacing, and default scale for each view, select the Preferences option from the right-click menu within the view canvas. These settings are controlled independently for each view type in ProjectExplorer.
For more details, see the Profile and Section Views section in the Preferences Window topic.
Copy to Clipboard
The contents of any view may be copied as a bitmap to the Windows Clipboard. This is useful in order to paste displayed content into other applications.
To copy the displayed content from any view to the Windows Clipboard, open the right-click menu from the view canvas and select Copy.
Dedicated View Features
Dedicated features for each individual view are generally accessed from the viewer toolbar which runs along the upper edge of each view canvas.
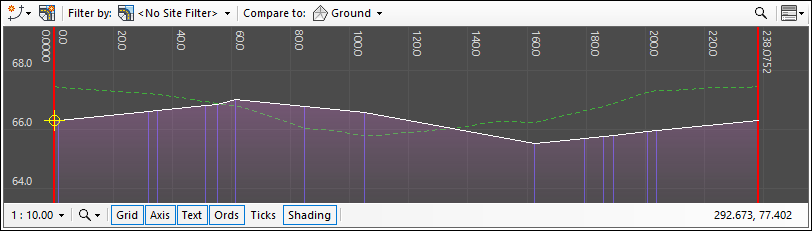
Profile View
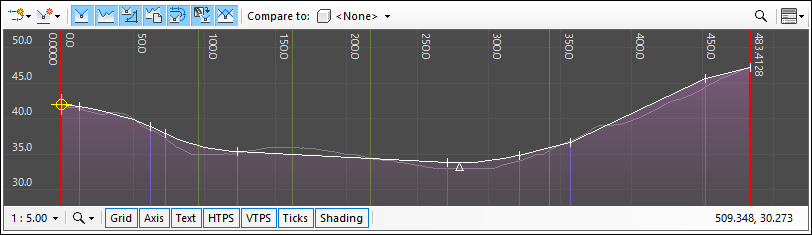
The Profile View in the Alignments tab displays all profiles directly associated with the currently selected alignment or profile. If no profiles are associated with the selected alignment, the station extents of the alignment and every alignment entity are displayed as vertical lines across the canvas instead. Unselected profiles associated with the currently selected alignment or profile are displayed in the secondary profile color (grey by default). If a profile is currently selected, that profile is displayed in the primary profile color (white by default).
Use the Profile Type Visibility check buttons to include or exclude different types of profile from the alignments and profiles list.
Using Compared Objects
To compare the station and elevation of points on the selected profile with other elements of your design, use the drop down list of objects adjacent to the "Compare to" label to select another alignment, profile, or surface in the current drawing. This will cause a compared profile line to be drawn on the profile view indicating the relationship between the compared object and the displayed profile. Additionally, the Calculated Stations list of points for the selected alignment or profile will show the compared elevation values and other relevant details for each displayed point.
Assembly View
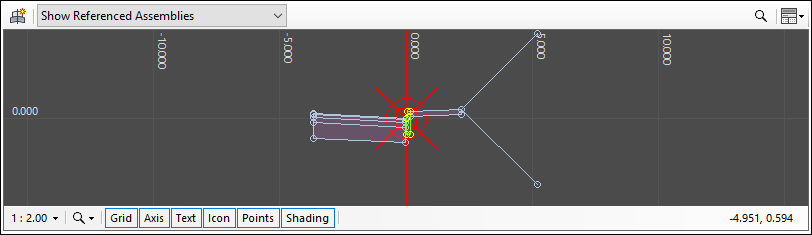
The Assembly View in the Assemblies tab displays a dynamic section through all subassemblies associated the currently selected assembly. Any subassembly which is selected in the subassemblies list is highlighted on the view canvas to allow for easy identification. Any changes made to any parameter on any of the display subassemblies are reflected in the Assembly View instantly.
Use the drop down list in the Assembly View toolbar to determine whether the Assemblies list should include all assemblies, or just referenced, unreferenced, violated, or unviolated assemblies. An unreferenced assembly is one which is not in use by any corridor regions in the current drawing.
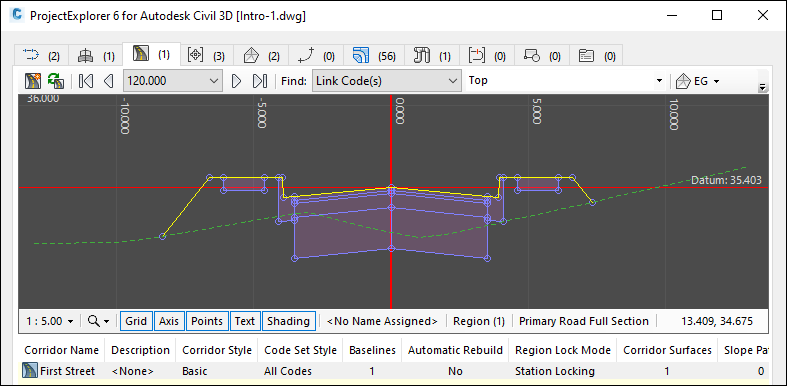
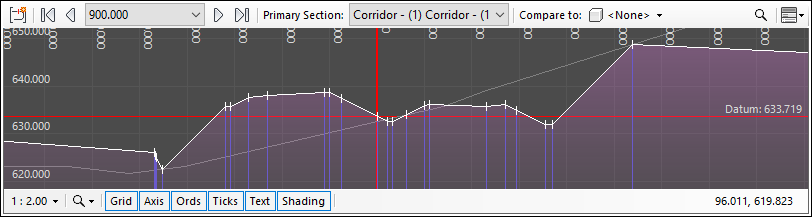
Corridor Section View
The Corridor View in the Corridors tab displays a dynamic section through the selected corridor at a range of station or chainage locations. Use the forward/back arrows or drop-down list of available stations in the Corridor to select the station at which to display a section. The Find option in the toolbar can then be used to highlight specific point, link or shape codes on the Corridor View. Codes can either be selected from a drop-down list, or typed into the field as a comma delimited list where multiple codes need to be highlighted.
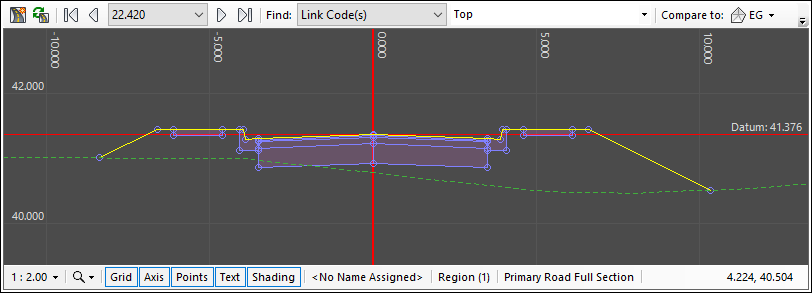
Using Compared Objects
To compare the offset and elevation of points on the selected corridor section with other elements of your design, use the drop down list of objects adjacent to the "Compare to" label to select any surface from the current drawing. This will cause a compared section line to be drawn on the Corridor View indicating the relationship between the compared surface and the displayed section. Additionally, the feature line points list for the selected corridor will show the compared surface elevation values and other relevant details for each feature line point.
Feature Line View
The Feature Line View in the Feature Lines tab displays a dynamic profile through any selected feature line. Use the site filter in the main toolbar to limit the list of feature lines to all, or to specific sites in the current drawing. Use the editing tools from the right-click menus on the feature lines list or feature line points list to apply changes to the elevation of one or more displayed points.
Using Compared Objects
To compare the station and elevation of points on the selected feature line with other elements of your design, use the drop down list of objects adjacent to the "Compare to" label to select another alignment, profile, or surface in the current drawing. This will cause a compared profile line to be drawn on the feature line view indicating the relationship between the compared object and the displayed feature line. Additionally, the feature line points list for the selected feature line will show the compared elevation values and other relevant details for each displayed point.
Pipe Network (Pipe Run) View
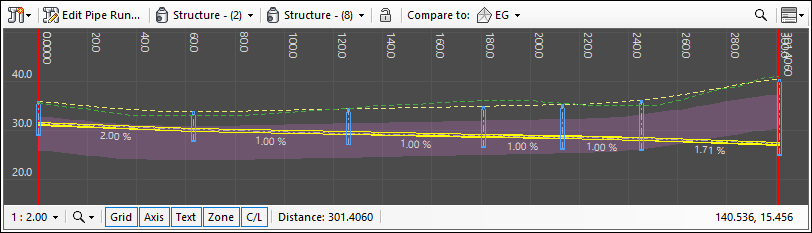
The Pipe Run View in the Pipe Networks tab displays a dynamic profile along the shortest pipe route between two structures in the selected pipe network. Use the drop-down structure lists in the toolbar to selected a start and end structure for the pipe run. Use the Edit Pipe Run option to adjust the slope of any pipes displayed in the current pipe run.
Using Compared Objects
To compare the station and elevation of points on the selected pipe run with other elements of your design, use the drop down list of objects adjacent to the "Compare to" label to select any surface from the current drawing. This will cause a compared profile line to be drawn on the Corridor View indicating the relationship between the compared surface and the displayed pipes and structures. Additionally, the pipe run interval list for the selected pipe run will show the compared surface elevation values and other relevant details for each point on the pipe run.
Sample Line Group Section View
The Sample Line Group Section View in the Sample Line Groups tab displays a dynamic section through the selected sample line group at any sample line location. Use the forward/back arrows or drop-down list of available sample line stations to select the station at which to display a section. The Primary Section list in the toolbar can then be used to highlight specific point, link or shape codes on the Corridor View. Codes can either be selected from a drop-down list, or typed into the field as a comma delimited list where multiple codes need to be highlighted.
Using Compared Objects
To compare the offset and elevation of points on the selected sample line section with other elements of your design, use the drop down list of objects adjacent to the "Compare to" label to select any surface from the current drawing. This will cause a compared section line to be drawn on the Corridor View indicating the relationship between the compared surface and the displayed section. Additionally, the section points list for the selected sample line will show the compared surface elevation values and other relevant details for each section point.